Phenotype, Genotype, Race: Three Words, Three Resolutions
Phenotype is a reading taken off a surface, genotype is a set of positions an assay queries, and race is a classification that needs boundaries. The dispute over a famous 85 percent figure is really about resolution.
Three words, three instruments
Putting phenotype, genotype and race into one sentence suggests they are competing answers to a single question, and they are not. A phenotype entry is a reading taken off a surface by an observer working to a stated rule. A genotype is an enumerated set of positions that a particular assay happened to query. Race is a classification, and a classification has to place a boundary somewhere before it can be used for anything. One of the three is an observation, one is a list, and one is a decision.
The comparison keeps being made because a search box takes phrases rather than questions, and because one statistic is quoted whenever the three words meet. That statistic is the roughly 85 percent of human genetic variation that sits within populations rather than between them, and almost every argument built on it is really an argument about the resolution at which data is being read. Read it at one locus and the words blur together. Read it across a few hundred and they separate. Read it at a single face and they come apart again.
What Lewontin's 85 percent counts
Richard Lewontin published the apportionment in 1972, in a chapter of Evolutionary Biology volume 6 running from page 381 to 398. His raw material was the blood groups and protein variants then available rather than sequence: a modest set of classical markers typed in a modest number of samples. He split the total variation into a within-population share of about 85.4 percent, a between-population-within-region share of roughly 8.3 percent, and a between-region share near 6.3 percent. The output was a budget of variance, not a verdict on who can be sorted from whom.
Read as a budget, the figure does exactly what it says. Take two people from one village and their marker profiles differ, on average, more than the average profiles of two continents differ from each other. That is a statement about where variation is stored, and it fits everything else known about a species that expanded recently out of a small founding population. It is also the reason a catalogue entry has to describe a distribution. An entry names a region and a span of time because what it can describe is a population, never a person.
Edwards and the correlation structure
Anthony Edwards answered in 2003, in BioEssays volume 25, issue 8, pages 798 to 801, under the title Human genetic diversity: Lewontin's fallacy. The apportionment, he argued, reads one locus at a time, and most of the information that tells populations apart is not held in the variation of any single marker. It is held in the correlation structure, in the way alleles at different positions travel together. Two populations can share nearly identical frequencies at every marker individually and still be separable from the joint pattern. The signal is real; the statistic simply was not pointing at it.
Edwards was making a narrow point about inference, and his paper gets overread. His target was the step from the number to the conclusion that dividing the species into groups is unjustified. He did not show that the groups are natural kinds and did not claim to. Twenty years later the exchange is still live: Charles Roseman argued in BioEssays in 2021 that the original 1972 chapter never made the inference attributed to it, and that the critics supply it themselves. A 2022 theme issue of Philosophical Transactions of the Royal Society B marked the fiftieth anniversary of the apportionment without closing the question.
The number of positions decides the answer
The cleanest reconciliation arrived in 2007 from David Witherspoon and colleagues, in Genetics volume 176, issue 1, pages 351 to 359. They measured a quantity they called omega: the probability that a random pair of individuals from two different populations is genetically more similar than a random pair drawn from any single population. With ten loci, omega came out near 30 percent. With a hundred, about 20 percent. With a thousand, roughly 10 percent. With tens of thousands of loci and geographically separated samples, it falls to zero. How many positions are queried is the variable that decides the answer.
Both classic results then survive, because they are answers at different resolutions. Classification methods lean on the aggregate properties of a population, so they can place individuals accurately while omega stays large. The same paper states the consequence for visible traits in a single line: phenotypes controlled by a dozen or fewer loci can be expected to show substantial overlap between populations. A face is not controlled by a dozen loci. The authors add a caveat that applies to any map, including this site's: highly accurate classification of individuals from continuously sampled, and therefore closely related, populations may be impossible. Some of the crispness of a cluster owes to where the sampler stopped.
The argument is still running
Nothing in this has settled into one number that everyone accepts. In 2016, Keith Hunley, Graciela Cabana and Jeffrey Long revisited the apportionment in the American Journal of Physical Anthropology, volume 160, issue 4, pages 561 to 569, and reported that the shares move depending on which markers are used and which populations are being compared. Roseman's 2021 reply pushes back the other way, defending the original measurement against its critics. The honest summary is that the 85 percent figure is a solid measurement of one thing, the inference drawn from it in 1972 was contested, and the contest was never settled by producing a better category.
What has not been produced is a workable classification. A classification needs boundaries and a rule of assignment. Human variation supplies gradients that run in different directions for different traits, so the boundary that suits one trait lands somewhere else than the boundary that suits the next. That is why a catalogue entry states a region, a date and an author and then stops. It can be precise about a documented distribution without ever becoming a statement about a living person, which is the only form the evidence supports.
The genotype now carries two other species
Sequence data added a complication the apportionment debate never anticipated. Genomes outside Africa carry roughly one to two percent Neanderthal ancestry. Populations in New Guinea and Aboriginal Australia carry between three and six percent Denisovan ancestry, the highest measured anywhere. Sub-Saharan African genomes carry around 0.3 percent Neanderthal, most of it arriving through back-migration from Eurasia rather than from any local encounter. A genotype, read as a document, is partly a record of contacts between groups that the typological literature never treated as one population at all.
Some of those segments do visible work. A Denisovan-derived variant of EPAS1 lets Tibetans keep haemoglobin close to lowland levels at altitude instead of overproducing red cells, which is the difference between functioning at four thousand metres and being ill there; Emilia Huerta-Sánchez and colleagues set out the evidence in Nature, volume 512, pages 194 to 197, in 2014. So a genotype can carry an inherited segment from another species while the phenotype record of the same region carries a described brow, nose and skull. No catalogue entry could have recorded it, because an entry describes a surface and this is a piece of ancestry.
Four entries, read as documents
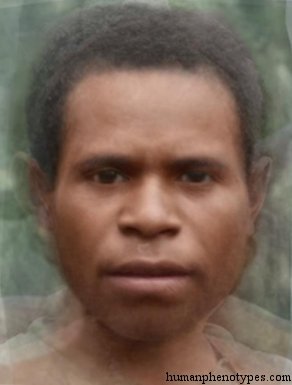
Four entries show the gap between a described look and a line of descent. Tapirid, the pygmy Melanesian type, is recorded with a reduced stature that its own note attributes to iodine deficiency rather than to inheritance, which makes it an appearance produced by environment and then catalogued as a type. Central Brachid is described as sitting between the West and East Indo Brachid forms while possibly arising from a different and more Alpinoid migration. Two possible origins are listed for one described look, and the entry does not decide between them.
Pre-Slavic is named after a language family and a period, so the axis of its label is linguistic and historical rather than biological. Pacifid Proper is anchored to the moist forests of the North Pacific coast, from the Aleutians across British Columbia to Oregon, which means its distribution follows an ecological belt rather than a political border. Both entries are precise about a place and a set of people, and neither of them makes a claim about an individual.
The catalogue is anchored in time as well. Its entries were reconstructed for roughly 1,500 years ago, and two centuries of labour migration, the forced movement of the transatlantic trade and the long-distance migration of the past seventy years have all moved the populations the entries were drawn from. Set beside the genotype, the three words separate cleanly. One records a surface. One records a set of positions and the contacts written into them. The third asks for a boundary that the material never supplies.
Frequently Asked Questions
- Why is the same 85 percent figure used for opposite conclusions?
- Because it measures apportionment, not separability. It states how much of the total variation is stored within populations rather than between them, and that measurement has held up. Whether populations can also be told apart from a large combined set of markers is a different question, and the answer there depends on how many positions are queried. Both results come out of the same data set. Quoting one without the other is a rhetorical move rather than a statistical one.
- Does a genotype determine a phenotype?
- No, and the gap opens in both directions. One genotype produces a range of measurements, because development and conditions are part of the outcome, which is why average height rose across whole countries within a century without allele frequencies shifting much. One described appearance can also arise from different inherited routes, so a shared look does not imply a shared descent. A phenotype catalogue records the visible pattern with a source and a date; it does not read a sequence.
- Why does this site describe phenotypes instead of using the word race?
- Because race operates as a classification that needs boundaries and an assignment rule, and the material supplies neither. Human variation runs along gradients that point in different directions for different traits, and the names in the historical literature were built as filing systems rather than as measured variables. This catalogue keeps 209 documented entries instead, each with a described pattern, a region, a named author and a reference list. That holds every claim at the size the evidence supports.
Related Phenotypes
Faces from the encyclopedia that appear in this article. Open any entry for its full description, distribution, and references.
Tapirid
Melanesia
Pygmy Melanesian type. In difference to many other Pygmies, it shares a common history with its taller neighbours and probably represents a ...
Central Brachid
Central Europe
Indo Brachid variety, with a morphological and geographical position between West and East (Indo) Brachids, but possibly resulting from diff...
Pre Slavic
Eastern Europe
Ancient Central European element, associated with Pre-Slavic people. Common in Poles and West Ukrainians, especially in Volhynia, Galicia, P...
Pacifid (proper)
North America
American type, native to the moist forests of the North Pacific coast, from Aleuts across South Alaska, British Columbia to Oregon. Purest i...
Test what you learned
Put your eye for regional faces to work in the daily quiz — a composite face, a world map, and your best guess.