A list of human phenotypes, read as 209 claims
The catalogue holds 209 named patterns, but only 130 of them name a neighbour, and four words do almost all of the relating between the rows.
Two hundred nine rows of prose
The catalogue holds 209 rows, and every row has the same five parts: a name, a region, a coordinate, a paragraph describing visible traits, and a list of publications. None of those parts is a measurement of a living person. The paragraph is a summary of what observers wrote down, and the publications say who wrote it and when. That format is the reason a count of the list is really a count of descriptions that somebody chose to write. A reader who wants a list of human phenotypes does get one, but the unit of the list is the claim, not the individual.
Only 130 entries name a neighbour
Every description can be searched for the name of every other entry, which turns the list into a rough graph of who compares to whom. The graph is sparse. Of the 209 entries, 130 name at least one other entry in their prose and 79 name none at all. The 130 produce 201 mentions between them, a mean of 0.96 per row and a maximum of four. Three names absorb much of the traffic: Armenid, Berberid and Iranid are each cited seven times, almost always as the type a smaller entry is being measured against. Contrast is an occasional device here rather than the organising principle.
Four words carry the relating
Where a relation does appear, the vocabulary is narrow, and the four families are not interchangeable. Two of them describe appearance, one describes a historical encounter, and one asserts a position between endpoints that the sentence never quantifies. A reader who treats all four as the same kind of statement will over-read the list, and the counts show how unevenly the four are used.
- Similar to appears 30 times, with resembles six more. It is the weakest claim in the set: shared described features, no stated criterion, and no measurement cited inside the sentence.
- Intermediate appears 16 times. It places an entry between two endpoints, but the endpoints are named as types rather than as values, so the position cannot be checked against anything.
- Contact type appears 14 times and transitional eight. These are historical claims: the entry is said to exist because two populations met at a particular place and produced a settled form.
- Differs from appears five times, with distinguish three. This is the only family that states an explicit contrast, and it is by far the rarest of the four.
One name, two referents
Gorid is the clearest case. Lundman defined the term in 1946 and used it again in 1967 as a synonym for East Alpinid. Eickstedt, writing in 1961, reserved East Alpinid for the eastern varieties and treated Gorid as a separate row, while Biasutti had published the same material as Carpatico in 1921 and again in 1967. The catalogue keeps Gorid, records that its name comes from the Polish word for mountain, and files the disagreement in the literature line. The row survives because the dispute was recorded rather than settled.
East Alpinid holds the mirror image of that dispute. Senyürek used the term in 1950 for Anatolian Alpinids, Eickstedt adopted it in 1961, Coon had called the same population Asiatic Alpine in 1939, Field described it from Iran and Iraq as Proto Alpine, and Gloor found it in Palestine. Five labels, one row, and a note that Lundman treated the name as a synonym for Gorid. A list that resolved these arguments would have fewer rows; this one keeps the arguments and calls them entries.
Aliases overlap without matching
Eurafricanid carries the longest alias trail in the collection. Deniker described a similar type in 1900, and the entry records that his version was later regarded as admixed and replaced. Haddon adopted Eurafricanid in 1925 from a term Sergi had used in a broader sense in 1901. Biasutti called the same material Littoral in 1967, Škerlj had called it Atlantid in 1936, and Coon, Hooton and Cole used Atlanto Mediterranid while folding in wider-faced types such as Berberid. Those four labels do not enclose the same area, so merging them would mean deciding which boundary to keep.
Congolesid shows the same problem in a shorter form. Eickstedt defined it as a Paleo Negrid subtype in 1934, Pales used Congolaise in 1953, Baker called it Palänegrid 1 in 1981, Biasutti placed it inside his Silvestre race, and Lundman filed it under Hylänegrid. None of those placements is a synonym in the strict sense. Each is a different parent category, and the entry's own reference list preserves all five without choosing between them.
What the anchors cannot hold
Two distances exist in the data and only one of them is computable. Coordinates were assigned from place names in each description, which is why 209 rows yield 209 distinct points. A distance in traits cannot be computed the same way, because the descriptions are prose: a nose is leptorrhine or mesorrhine, a skull is brachycephalic or dolichocephalic, and those words were never converted back into the millimetres the observers had recorded. Nearest neighbour on the map is a fact about where an author placed a type, not about which type it resembles.
The rows also describe a moment that has since been disturbed, and one entry says so in its own text. Appalacid, native to the Atlantic forests from the Great Lakes to the Appalachians, records that it shows some Europid traits in appearance and in genetics, then offers two explanations: colonial admixture, or a proposed Atlantic migration predating the Bering crossing. The second has not survived scrutiny of ancient genomes, which leaves admixture, an event well after the catalogue's 1,500-year baseline.
That is the general condition rather than an exception. Each row was assembled from fieldwork done between the 1880s and the 1980s, and the fieldwork recorded the populations it could reach at the time. Where a later author could not find the pattern in an unmixed form, the entry tends to say so in a phrase such as rare today, which is a statement about the observer's decade as much as about the pattern.
How to read the list without flattening it
Four habits make the collection usable. Read the literature line before the trait paragraph, because it identifies which national school the row belongs to and therefore which vocabulary is in play. Treat the trait paragraph as a summary of a sample, never as a description of a place. Stop at every relation word, since that is where the author admits a boundary is uncertain. And hold the number 209 loosely, because the format has no rule preventing one row from being split into three by the next author who looks closely.
None of this makes the list worthless, and the alternative would be worse. What the collection offers is a set of dated arguments about visible variation, each with a citation trail a reader can follow back to the monograph that defined it. A list that hid those seams would be easier to read and impossible to check, and the checking is the only thing that separates a catalogue from a rumour.
Frequently Asked Questions
- How many human phenotypes are in this list?
- This collection contains 209 named entries spread across 22 regions. The figure counts rows, not people and not biological kinds: each row is a description of visible traits attributed to a named author and a year, with a citation list behind it. Because authors disagreed about boundaries, splitting one row or merging two would change the total without adding a single new observation. Treat 209 as the size of this particular collection rather than as a count of human variation.
- Why do some entries name other entries and others do not?
- Only 130 of the 209 descriptions mention another entry by name, producing 201 references in total. The entries that do are usually the ones an author needed to distinguish from a neighbour, which is why Armenid, Berberid and Iranid appear most often, seven times each. The 79 that name no neighbour were defined positively, by describing their own traits without a comparison in the text. The uneven coverage reflects writing habits rather than any difference in how well those patterns were documented.
- Does a nearby entry on the map mean a similar appearance?
- No. Coordinates were assigned from place names in the descriptions, so two rows can sit close together because an author wrote about neighbouring valleys, not because the patterns resemble each other. The trait descriptions are prose rather than measurements, so no distance in appearance can be calculated from them. Proximity on the map records where a type was placed, and the relation words, which appear in about two thirds of the entries, are the better guide to which ones were actually compared.
Related Phenotypes
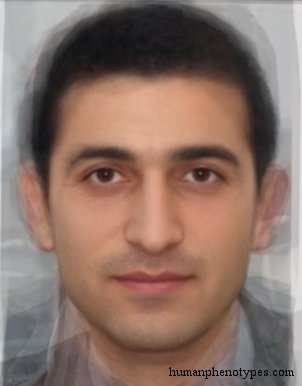
Faces from the encyclopedia that appear in this article. Open any entry for its full description, distribution, and references.
Armenid
Caucasus
Widespread type, found in its most specialised form in the mountains of Asia Minor. Associated with the ancient Cypriots and the Hittite Kin...
Gorid
Central Europe
East Alpinid variety, named after the Polish word for mountain (Gora). Metrically intermediate between West Alpinid and East Europid. The nu...
Eurafricanid
Southern Europe
Atlanto Mediterranid proper type. Relatively old, present in early Natufians and European as well as North African megalith builders. Spread...
Appalacid
North America
Silvid subtype, native to the North American Atlantic forests, from the Great Lakes to the Appalachians. Shows some Europid traits, not only...
Test what you learned
Put your eye for regional faces to work in the daily quiz — a composite face, a world map, and your best guess.