Ancestry Guesser: Who Decides How Many Answers Exist
An ancestry guesser has to be told how many ancestral populations to look for, and that one setting shapes the answer more than the data do. Three programs, three conventions, one choice nobody advertises.
What the word ancestry asks a program to do
Geneticists use ancestry in two senses that a single web form tends to collapse. Global ancestry is a set of proportions for a whole genome, the kind of figure a consumer report prints as a chart. Local ancestry is a label per stretch of chromosome, and the two can disagree sharply for the same person, because an average of twenty per cent does not say whether one grandparent contributed everything or many ancestors contributed a little. Alexander, Novembre and Lange drew that distinction at the start of their 2009 ADMIXTURE paper in Genome Research, and it is the first thing to establish before asking any tool for a number.
K is a setting, not a discovery
Pritchard, Stephens and Donnelly opened their 2000 paper in Genetics with the assumption that there are K populations, where K may be unknown. The model then assigns each person a probability of belonging to each of those K groups, or a mixture of them, with no signal in the output announcing that K was the right number to try. In practice an analyst runs several values and compares the fit, and ADMIXTURE later added cross-validation error for exactly this purpose, but the choice remains a judgement about the resolution at which the data should be described rather than a fact recovered from the data.
Change K from four to seven and the same genotypes produce a different set of proportions under different names. The lower setting merges groups that the higher one separates, and the higher setting sometimes splits a well-sampled group into two halves that track sampling sites as much as history. Neither run is a mistake. They are two descriptions of one dataset at two resolutions, and a report that prints four percentages without saying why four was chosen has hidden the most consequential decision in the pipeline.
Millions of markers, continental resolution
The most useful sentence in this literature is a limitation stated by its own authors. Maples, Gravel, Kenny and Bustamante began their 2013 RFMix paper in the American Journal of Human Genetics by noting that existing methods can only detect continental level ancestry accurately even when using millions of markers. That is the honest ceiling, written by people who had every incentive to claim more. Hundreds of thousands of sites separate European from African from East Asian input well. They do not separate one province from the next, and they say nothing at all about a photograph.
The components themselves are named by the analyst, not announced by the genome. An ancestral population in these models is a set of allele frequencies estimated from whichever groups the study included, so a component carrying a regional label is a summary of those particular samples. Swap the panel and the same person's proportions move, not because anything about the person changed but because the comparison set did. Any tool that returns a label without returning the sample it was compared against has given a reader a number with no unit attached.
Local ancestry turns a chromosome into a mosaic
RFMix works per segment, using a conditional random field trained on reference haplotypes, and it ran roughly thirty times faster than the methods it replaced while learning from the admixed samples themselves to correct phasing errors. Its authors also reported that African Americans in HapMap carry about 0.4 per cent Native American ancestry, a small non-zero figure that only a segment level method could produce cleanly. The number is the point. A global average would have rounded it away, and any claim about a distant ancestor depends entirely on which segments survived and how long they are.
Two programs, two shapes of answer
STRUCTURE and ADMIXTURE fit the same likelihood model, and ADMIXTURE solves in minutes what took STRUCTURE hours, which is why the second became the default for large panels. EIGENSTRAT takes a different route through principal components and, as the ADMIXTURE paper observes, does not directly deliver admixture fractions. Three tools, three output shapes, one dataset. A reader comparing two ancestry reports produced by different programs is often comparing conventions rather than people, and neither vendor is obliged to disclose which convention it used or which K it settled on.
Where the catalogue records contact instead of percentages
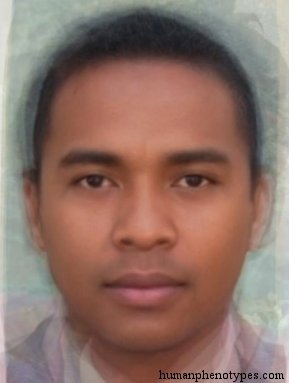
The catalogue handles mixture differently, by naming contact types rather than estimating proportions. Malagasid is described as a Bantuid and South Mongolid contact type formed when Malay arrivals from the Sunda islands met Bantu from East Africa, with Arabid and Indid elements entering later. Aralid records the opposite direction, developed when Hunnic, Avar and Chasar expansions replaced older Turanid, Mediterranid and Nordid populations on the Central Asian steppe. Baykal is tied to Lake Baikal and to a population the entry puts below one hundred thousand. Kolid is a North Dravidian type related to Melanids with stronger Gondid influence, described as transitional toward East Brachids in Bengal.
These are diffusion statements rather than percentages. Each names who moved, roughly where they arrived and what was there before, and none of them pretends to apportion a living person into fractions. That is a weaker claim than a genotype panel makes and also a more durable one, because it does not depend on which samples happened to be in a reference set. The cost is resolution: a contact type cannot tell you that one ancestor in eight came from a particular valley, and a genotype panel cannot tell you that the resulting appearance was ever a named pattern anyone recorded.
A photograph is not a genotype
None of the machinery above can run on an image. A genotype panel needs hundreds of thousands of sites, and a photograph supplies none of them, so a tool that offers to guess ancestry from a face is estimating from a historical catalogue of appearance rather than measuring descent. That estimate inherits every limit of the catalogue: a baseline roughly fifteen hundred years old, entries drawn from anthropometric literature with its own sampling problems, and distributions that later movement has rearranged many times over.
This site's own quiz is a geography game built on that catalogue, and it would be dishonest to dress it as an ancestry report. The useful question is not whether a face can reveal descent, which it cannot, but what the recorded patterns describe and where those descriptions came from. Read an entry as a note about what observers saw in a region centuries ago and it stays useful. Read it as a statement about the person in front of you and it stops being true.
Frequently Asked Questions
- How does an ancestry guesser choose how many populations to report?
- A person, not the data, sets it. Model-based methods such as STRUCTURE and ADMIXTURE assume a fixed number of ancestral populations, usually written K, and the analyst runs several values and compares the fit. ADMIXTURE adds cross-validation error to make that comparison easier, but the curve often has no sharp minimum. Raising K splits groups, lowering it merges them, and both runs describe the same genotypes. A report that prints proportions without stating K and how it was chosen has omitted the decision that produced the numbers.
- Can a photo really reveal someone's genetic ancestry?
- No. Ancestry inference from DNA requires genotype data at hundreds of thousands of sites, and a photograph contains none. A tool that reads a face is comparing visible features against a catalogue of documented appearance patterns, which is a different question with a much coarser answer. Appearance is influenced by many genes and by environment, varies continuously across regions, and does not encode a percentage of anything. Treat any face based ancestry score as a guess about recorded regional patterns, not as a measurement of descent.
- Why do two ancestry reports for the same person disagree?
- They are usually answering at different resolutions with different comparison sets. One may report four ancestral components, another seven, and the extra three are subdivisions of the same data rather than new findings. The reference samples behind each component also differ between providers, so identical genotypes can be apportioned differently. Add differences in algorithm, since principal component methods and model-based methods return different output shapes, and disagreement becomes the expected result rather than evidence that one report is wrong.
Related Phenotypes
Faces from the encyclopedia that appear in this article. Open any entry for its full description, distribution, and references.
Malagasid
Sub-Saharan Africa
Relatively recent Bantuid-South Mongolid contact type native to the island of Madagascar. Formed when Malay immigrants from the Sunda Island...
Aralid
Central Asia
West Tungid variety of the vast Central Asian steppes, influenced by Turanid. Developed in ancient times when Hunnic, Avar, and Chasar expan...
Baykal
Siberia
Northern Tungid variety, native to the vast, sparsely populated Taiga and Tundra regions of East Siberia, adapted to survive in the coldest ...
Kolid
South Asia
North Dravidian type, related to Melanids but with stronger Gondid influence. An important population element in India. Purest in Jharkhand ...
Test what you learned
Put your eye for regional faces to work in the daily quiz — a composite face, a world map, and your best guess.