Am I Mixed: What a Face Cannot Hold Is a Proportion
Whether someone counts as mixed depends on which question is being asked: a family record, a genetic panel, or a face. Only two of those three can be checked.
Three questions wearing one phrase
The question am I mixed folds three separate questions into one sentence. The first is genealogical, about who your ancestors were, and it is answerable from records for as far back as the records reach. The second is genetic, about what share of your genome matches each reference population, and it is answerable from a sample plus a stated panel. The third is about appearance, and it is not a question about shares at all, because a face does not carry a proportion of anything.
The three come apart in ordinary cases. Siblings inherit different shares from the same two parents and can look unalike; a person with a quarter of their ancestry from one region may show none of the features a catalogue associates with that region. The shares are real and measurable. The step from share to appearance is where the question stops working.
How a genome records a mixture
A mixture leaves a physical trace in the chromosomes. When two long-separated populations interbreed, each descendant carries long stretches of DNA inherited intact from one source, and those stretches shorten with every further generation, because recombination cuts them. The working rule is that the mean length of an ancestry block, measured in Morgans, is about one over the number of generations since the mixture. Six generations leave blocks near 17 centimorgans; twenty generations leave about 5. Pool and Nielsen set out the inference framework in Genome Research in 2009.
The same arithmetic sets a floor on what any test can see. Below roughly one or two centimorgans a block is hard to separate from the ordinary background pattern of variation, which puts the limit somewhere between fifty and a hundred generations, or about 1,250 to 3,000 years at 25 years per generation. Mixtures older than that are not missing from a genome. They have become indistinguishable from the baseline, which is roughly the period this catalogue means when it says 1500 years ago.
The reference panel decides the answer
An ancestry estimate is a decomposition against a fixed list of reference populations, and the list is a choice made by whoever built the calculator. The 1000 Genomes Project's final phase genotyped 2,504 people from 26 populations, so a tool built on it can return at most 26 parts no matter how thoroughly mixed the sample is. Swap the panel and the percentages move, without a single base pair of the sample changing. That is not deceit. It is what projecting a point onto a set of axes does.
It also means the question has no answer independent of the ruler used to ask it. A genome that forms a smooth gradient across a continent will be reported as a blend of whichever populations the panel happens to sample, because a gradient has to be cut into segments before it can be named. Two companies can disagree about the same person and both be describing their own reference set accurately.
Why a face cannot carry the fraction
Pigmentation is the trait people reach for first, and it shows the gap most clearly. SLC24A5 on chromosome 15 carries a variant, rs1426654, that is near fixation in European populations and common in South Asia as well. Stokowski and colleagues, in the American Journal of Human Genetics in 2007, found that this single variant accounted for roughly a third of the variation in skin pigmentation in a South Asian sample. That is a large effect for one site, and it still leaves most of the variance unexplained.
Skin colour is polygenic, with dozens of loci of small effect identified and more added each year, and the same holds for the other visible traits. None of them reports a share of ancestry, because a trait is a developmental outcome rather than a tally. A face summarises a few hundred genes acting in one environment. A genome is three billion positions, and most of them have no bearing on how anyone looks.
The labels were mixed before the people were
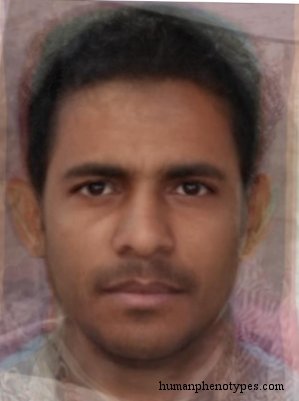
The typological literature is often read as a list of pure types, which it never was. Arabian Veddoid, named by Carleton Coon in The Races of Europe in 1939, joins two distant places in one label: a pattern described for the Mehri of southern Oman, for Hadramaut and for Socotra, which Coon linked to the Veddoids of Sri Lanka. The entry calls it often heavily mixed and leaves open whether it descends from the ancestral Arabian population or from Dravidian India.
Anglo-Saxon does the same more quietly, naming a pattern after three groups, the Angles, Saxons and Jutes, who arrived in Britain from the fifth century and merged with the people already there. Borreby takes its name from Neolithic skulls in Denmark and then hedges inside its own entry, noting that the name does not cover all of them. Mixture sits in the vocabulary; it was not discovered later and added on.
What the modern map did to the names
Every entry describes a distribution at a date, and the dates are old. Since the baseline this catalogue works from, the Atlantic trade carried millions of people across an ocean, European emigration resettled two continents, the twentieth century redrew eastern Europe twice, and the last seventy years produced movement at a volume no earlier period matches. The descriptions stayed where they were written. Baskid, which locates its least mixed form in the Pyrenees-Atlantiques, adds that many modern French Basques are West Alpinid, so the entry itself records a replacement in its own homeland.
Official categories move too, and not only because populations do. In the United States the 2020 census counted 33.8 million people, 10.2 percent of the population, reporting more than one race, against 9.0 million and 2.9 percent in 2010. A large part of that jump came from changes in how write-in answers were coded, so the rise measures the form as much as the country. A label that moves when the paperwork moves is a label about paperwork.
What the question can actually get
If the question is genealogical, records answer part of it, unevenly and with a bias toward the documented. If it is genetic, a test returns shares, and an honest version states the panel, the number of reference populations and the generation depth the method can resolve. If it is about appearance, the answer is a description of a documented pattern plus a plain statement that the pattern was never a property of one person. Three questions, three kinds of evidence, and none of them is a verdict.
The game on this site returns a distance on a map, which measures how well a composite face was recognised, and says nothing about the player. That is not a gap to apologise for. A game with a checkable answer and a catalogue with citable sources are both more useful than a percentage that resembles a fact, and neither of them claims to know what anyone is.
Frequently Asked Questions
- Can a face show whether someone is mixed?
- No. Visible traits are controlled by many genes of small effect, and their combinations do not track the proportions of a person's ancestry. A face can show which documented appearance patterns it resembles, and nothing about how much of anyone's genome came from where. Even pigmentation, the trait most often used as a shortcut, is polygenic, and the strongest single variant known accounts for only part of the variation in any sample studied. Reading a proportion off a face is not a small error; it is a category error.
- How far back can a DNA test detect mixture?
- It depends on the reference panel and the density of markers, but there is a rough ceiling. Ancestry blocks shorten by about half with each generation of further mixing, so mean block length in Morgans is roughly one over the number of generations. Once blocks fall below one or two centimorgans they are difficult to separate from background variation, which places the limit near fifty to a hundred generations, or roughly 1,250 to 3,000 years. Older mixtures are usually reported as part of the baseline rather than as an event.
- Why do different DNA tests give different percentages?
- Because each company decomposes a genome against its own list of reference populations, and a different list produces different parts. The 1000 Genomes Project's final phase, for instance, sampled 2,504 people from 26 populations, so a calculator built on that panel can only return 26 components. Add a reference group from a region your family came from and its share may appear where none was reported before. The percentages describe the panel as much as the person, which is why a result is only meaningful alongside the panel it used.
Related Phenotypes
Faces from the encyclopedia that appear in this article. Open any entry for its full description, distribution, and references.
Arabian Veddoid
Middle East
Ancient Vedda-like type of the Arabian Peninsula and South Iran, often heavily mixed. Found in the Mehri of South Oman, around Hadramaut in ...
Anglo-Saxon
Northern Europe
North-West European type, similar to Trønder, but with a stronger Hallstatt component. Was typified by the ancient Germanic tribes of Angles...
Baskid
Southern Europe
Ancient European type associated with the Basques. Found in its purest form in the Pyrénées-Atlantiques region of Southwestern France, altho...
Borreby
Central Europe
Ancient Northern European variety. Named after some of the Neolithic Borreby skulls of Denmark (not all!). Some emphasised resemblance with ...
Test what you learned
Put your eye for regional faces to work in the daily quiz — a composite face, a world map, and your best guess.